Virtual care or telehealth managers have access to a data dashboard managed by eHealth NSW. It is often referred to as Splunk or the myVC Data Dashboard.
Unit managers should contact their virtual care or telehealth manager to discuss their data needs. Monthly data slides are developed, summarising statewide activity. This supports presentations and planning. Your virtual care or telehealth manager will have access to these slides.
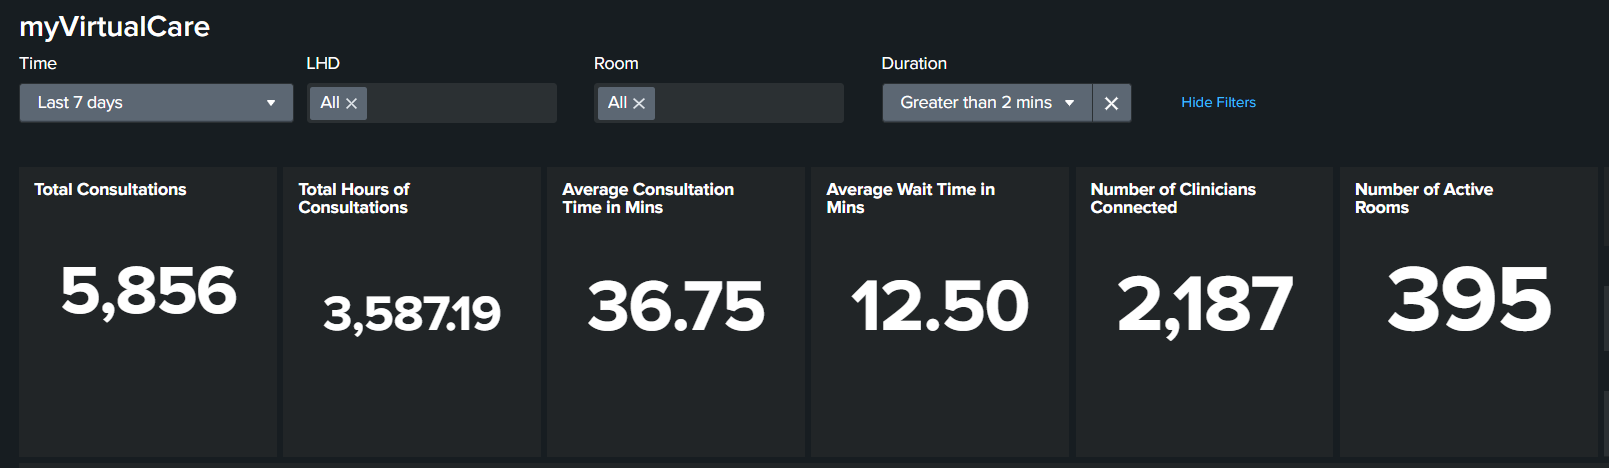
Examples of the data captured in Splunk
- Number of consultations
- Length of consultations
- Average wait time
- Number of connected clinicians
- Number of active rooms
- Other connected participants
Cloud dashboard
The dashboard transitioned to the cloud in June 2021. Please ensure you are accessing the dashboard from the cloud version https://nswhealth.splunkcloud.com. If you have not updated your preferences to the correct time zone, your data may be misreported.
Please note, we have been advised that the cloud will only display data for 90 days. To avoid the disappointment of potentially losing data, please export and save your data each month.
myVC is not used for non-clinical purposes and all training activity should be conducted in the TRAIN environment to keep the data representing true clinical consultations.
How the ACI Virtual Care team uses Splunk
The ACI Virtual Care team provides data to the Ministry of Health each month to report against targets and growth. For the purposes of data analysis and reporting, we reference (exported) enterprise data for the period 31 August to December 2020.
From January 2021 onwards, cloud data has become the source of truth for myVC statistics. When analysing myVC data, the Virtual Care team sets the date range for the full month and filter for consults longer than two minutes.
For consistency, we recommend that when reporting any data, the filter to remove all calls under two minutes (<2mins) is used.